High throughput Azure Functions on HTTP
azure-functions application-insights
Is the Azure Functions service able to achieve 1000 HTTP request per second without degradation in latency and reliability?
March 5, 2018
Is the Azure Functions service able to achieve 1000 HTTP request per second without degradation in latency and reliability? Of course it is, that's what this article is about! Read on to learn more about considerations, fine-tuning and monitoring of a high-scale HTTP scenario.
For those not familiar with Azure Functions - it's an application hosting service from the Microsoft Azure serverless family. You provide code, Functions take care of triggering it, scaling the infrastructure and management.
[UPDATE 12/04/2018]
Still experimenting with tweaking the performance. Today I've added results from one more run - without writing to the Table Storage.
[UPDATE 03/12/2018]
Only a few days after first publishing my results, I found out that there's now the possibility to switch to a new scaling model by adding an Application Setting called WEBSITE_HTTPSCALEV2_ENABLED with the value of 1. So I ran the Consumption test again and added new results.
tl;dr
Enough talking, take me to the results!
I've run a series of load tests to figure out how Azure Functions perform.
- Consumption plan adapts very well to spike load and is able to reach 1000 RPS without an error.
- App Service plans running on 1 instance cease to respond after a few minutes (6, 7...).
- For this particular scenario there's not much of a difference between S and P plans.
Contents
Problem Statement & Requirements
In February we spent three days hacking with developers from Cross Masters, exploring ways of improving their solution using Microsoft Azure. The scenario was to serve an "invisible pixel" to web users and store basic information about them for further big-data analysis.
The requirements were:
- serve at least 1000 requests per second (RPS),
- use HTTPS and return 1px image response to every user,
- read basic information from every request and store it to Table Storage,
- fail as least as possible (ideally never),
- don't be crazy expensive :)
Architecture
The core of our solution was an HTTP-triggered Azure Function. We then chose Storage Tables as the data store, because they were capable of handling at least 20,000 requests per second.

Every user sends a GET request to the Function's public URL. This request contains table name (one table per client, which can be for example a marketing organization), query string parameter and a cookie.
Table for one client (organization) can look like this:
| PartitionKey | RowKey | Timestamp | Tracker |
|---|---|---|---|
| user1 | f5cd841f-7bfc-4d9b-a62a-26a06490d766 | 2018-02-28T11:20:41.522Z | QM23LLSD3 |
| user3 | 051f5b7e-e1c9-41fc-9b0c-9bb2b4ef7356 | 2018-02-28T11:20:47.278Z | QMSD43223 |
We decided to partition data by user IDs as we expected to have large amounts of events per user and further processing by this ID. RowKey is just an arbitrary GUID.
Due to the fact that every request has to be processed by the backend, it was not possible to employ a caching mechanism (such as CDN) to optimize performance.
Implementation
Azure Functions are a very convenient way to implement serverless backend service such as this one. We had to do some tweaks around logging to get the best performance possible and then run a series of load tests.
The Function
The function itself is fairly simple, but it still does some actual work. Its main purpose is to return an invisible pixel and save request-specific information into Storage Table. Bindings are used for that:
public static class Track
{
    [FunctionName("Track")]
    public static HttpResponseMessage Run(
        [HttpTrigger(AuthorizationLevel.Anonymous, "get", Route = "track/{tableName}")]HttpRequestMessage req,
        [Table("{tableName}", Connection = "AzureWebJobsStorage")] out TableRow tableOutput)
    {
        string account = req.GetQueryNameValuePairs()
            .FirstOrDefault(q => string.Compare(q.Key, "account", true) == 0)
            .Value;

        string tracker = "";
        var cookie = req.Headers.GetCookies("trackingId")?.FirstOrDefault();
        if (cookie != null && !string.IsNullOrEmpty(cookie["trackingId"].Value))
            tracker = cookie["trackingId"].Value;

        byte[] respBytes = Convert.FromBase64String("iVBORw0KGgoAAAANSUhEUgAAAAEAAAABCAYAAAAfFcSJAAAADUlEQVR42mNk+P+/HgAFhAJ/wlseKgAAAABJRU5ErkJggg==");

        var resp = req.CreateResponse(HttpStatusCode.OK);
        resp.Content = new ByteArrayContent(respBytes);
        resp.Content.Headers.ContentType = new System.Net.Http.Headers.MediaTypeHeaderValue("image/png");

        tableOutput = new TableRow()
        {
            PartitionKey = account,
            RowKey = Guid.NewGuid().ToString(),
            Tracker = tracker
        };

        return resp;
    }
}

public class TableRow : TableEntity
{
    public string Tracker { get; set; }
}
Name of the table differs per customer who is using the tracker. In this case we just take it from the URL as tableName and use it in Table binding:
[HttpTrigger(AuthorizationLevel.Anonymous, "get", Route = "track/{tableName}")]HttpRequestMessage req,
[Table("{tableName}", Connection = "AzureWebJobsStorage")] out TableRow tableOutput
Just to prove a point, we also extract information from query string (account parameter) and from cookie, because the production application will do exactly that.
The invisible pixel is encoded to Base64 and sent back to the user as ByteArray with the header of image/png.
ByteArrayContentclass doesn't provide the option to set media type in its constructor (unlikeStringContentfor instance), but you can set it as a header after instantiation. Just remember to set the Content's header, not the response's.
Also note that there's no logging inside the function itself. That's intentional, see next section.
Optimization
Azure Functions have a logging mechanism turned on by default. It's great for development, because you can immediately see what's going on with your code and how the execution proceeds. Also if your function is run only several times a day, it can be serve as a good enough monitoring solution.
Our function was run a thousand times per second, though, and built-in logging slowed it down significantly. So how to disable it?
It's actually quite simple: just delete the AzureWebJobsDashboard application setting.
Monitoring
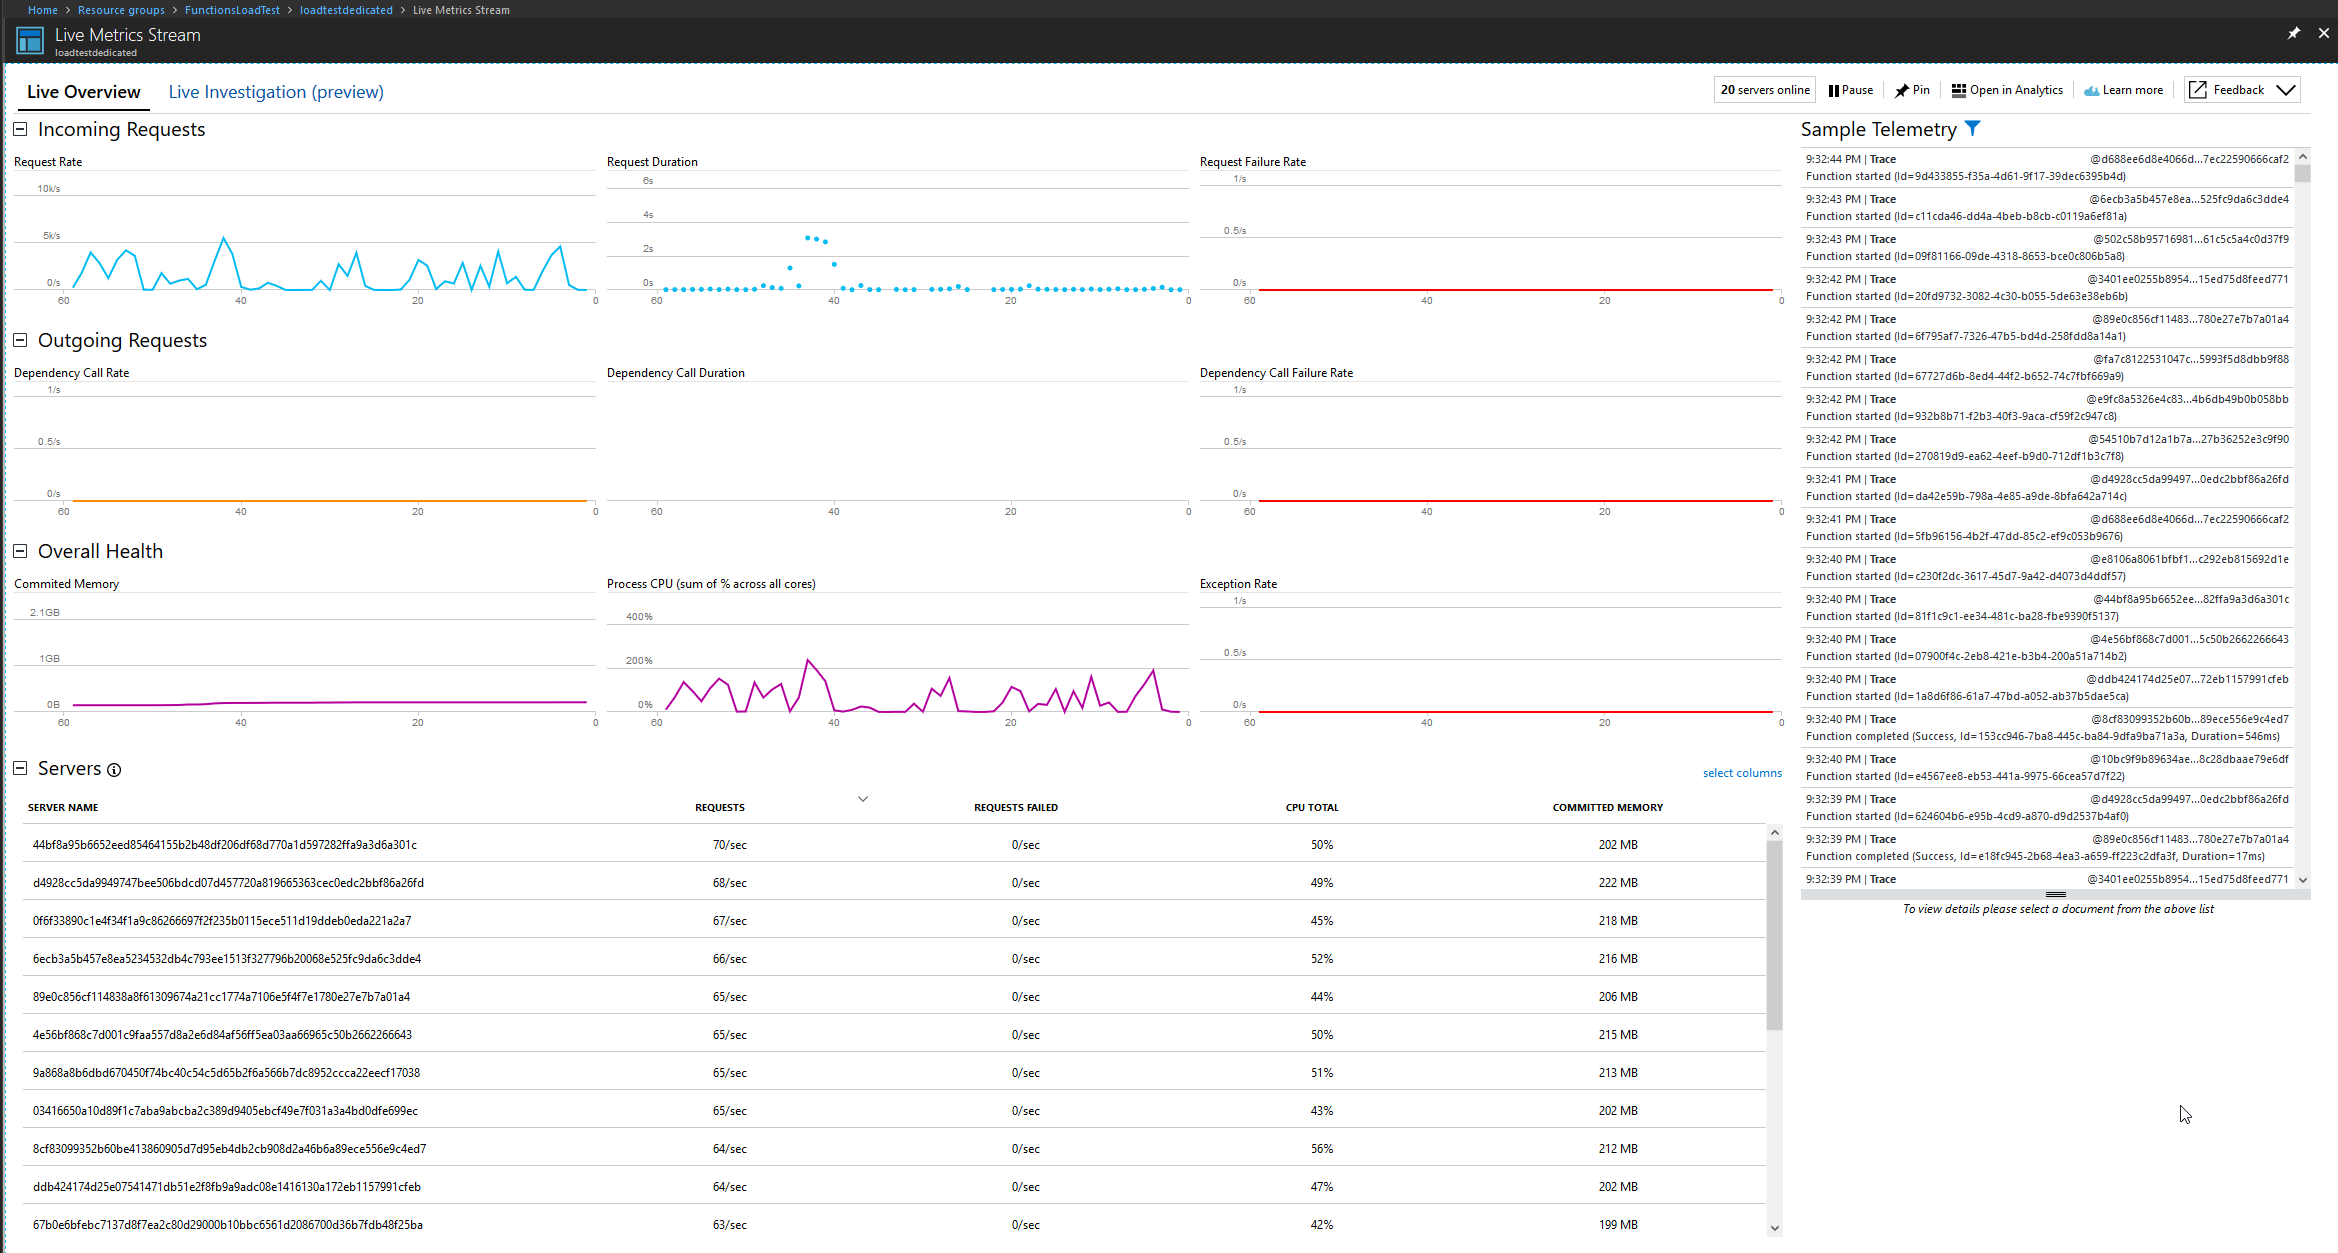
Cool, the function is now blazing fast, but... how do we know what's going on with logging turned off? Application Insights to the rescue!
Azure Functions introduced advanced support for Application Insights in 2017 and its integration is very easy. Just create a new Application Insights resource and add the instrumentation key to your Function's application settings:
APPINSIGHTS_INSTRUMENTATIONKEY = your key
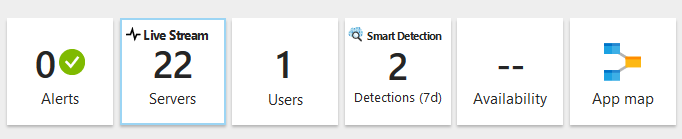
The most amazing feature for me is the Live Stream where you can watch how many servers are currently in use and to what extent (even for the Consumption plan!).
Load Test
I used Visual Studio 2017 Enterprise to build the test and Visual Studio Team Services (VSTS) to orchestrate it and collect results. The scenario is a regular Web performance test. To simulate load from different users and test saving to several table paritions, I prepared two CSV files:
- tables.csv with 15 table names (
customer1tocustomer15), - usernames.csv with 10 user names (
user1touser10).
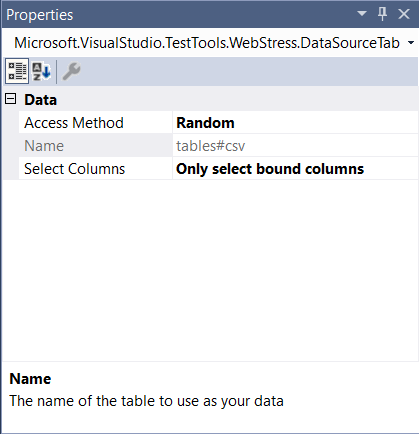
The test is set up in a way that it randomly grabs table and user names and adds them to the service URL:

Because I wanted to generate higher load (20k concurrent users, 20 minute duration), I've set up a custom virtual machine rig in Azure and connected it to VSTS. Check this blogpost to see how.
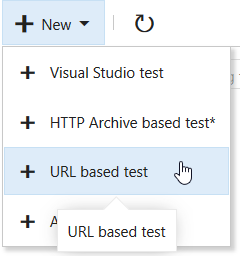
You don't have to use Visual Studio 2017 to run simple URL-based tests. VSTS also has an interface for them. You will not be able to use parametrization though.
One thing that caught me off guard was the OutOfMemoryException. In one of the test runs I have noticed a sudden user load drop and quickly learned that one of the agent machines failed due to the lack of memory. That was strange since both machines in my rig had 28 GB of RAM. But then I paid attention to one particular warning:
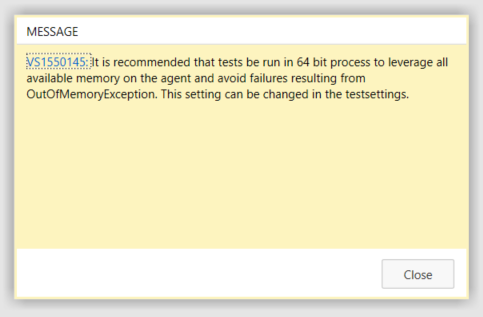
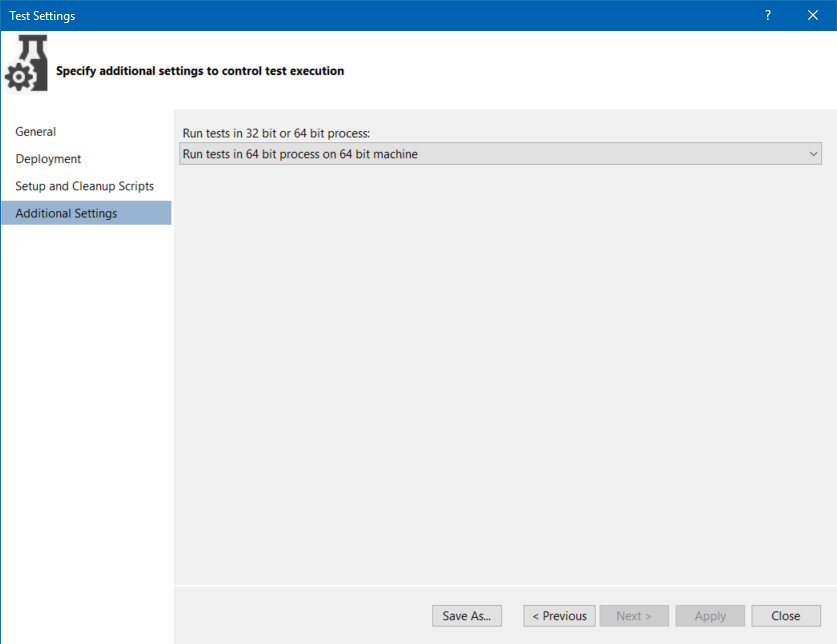
Of course I was running my tests as 32bit processes! To solve this I had to change my .testsettings file to Run tests in 64 bit process on 64 bit machine.
Results
Let's get to the meat of it - the results! I've ran a series of burst tests to see how well the Consumption plan adapts to sudden high load and how it compares to App Service plans (which are supposed to be more performant and predictable).
I did not use auto-scale with the App Service plans, because they have 5 minute cooldown which wouldn't work well in this sudden load.
Test parameters:
- test duration: 20 minutes
- warmup duration: 2 minutes
- target user count: 20 000
- thinking time: 0
Results from each configuration are summed in a table which also contains a price estimate based on publicly listed prices. There's one value for 20 minutes ("how much was this particular test") and another for the whole 1 hour ("how much would this exact load cost for 1 hour"). Bear in mind that this is only the cost for compute resources. Table Storage and networking are billed separately and would cost the same for every test.
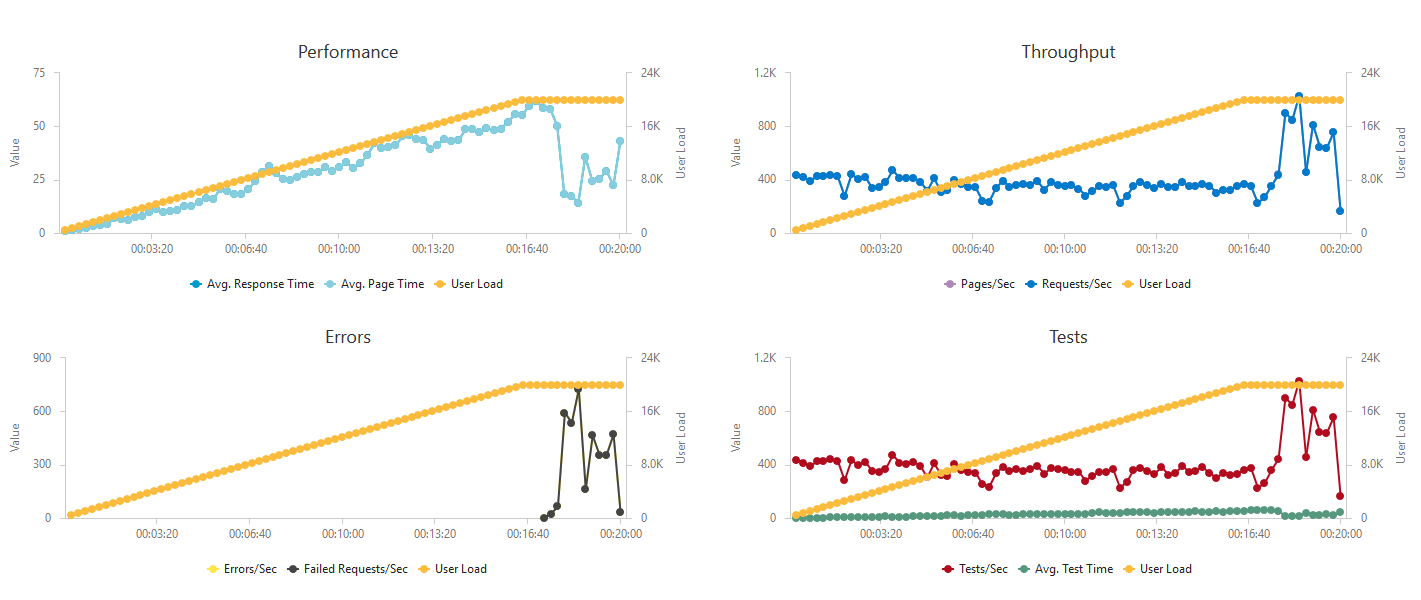
Consumption plan
Consumption plan was the reference configuration as I wanted to see how it would cope with spikes.
| Total requests | 1 097 659 |
|---|---|
| Failed requests | 262 |
| Max servers used | 35 |
| Average RPS | 914 |
| Max RPS | 1711 |
| Average response time | 8.7 s |
| Estimated price (20 minutes) | $5.75 |
| Estimated price (1 hour) | $17.25 |
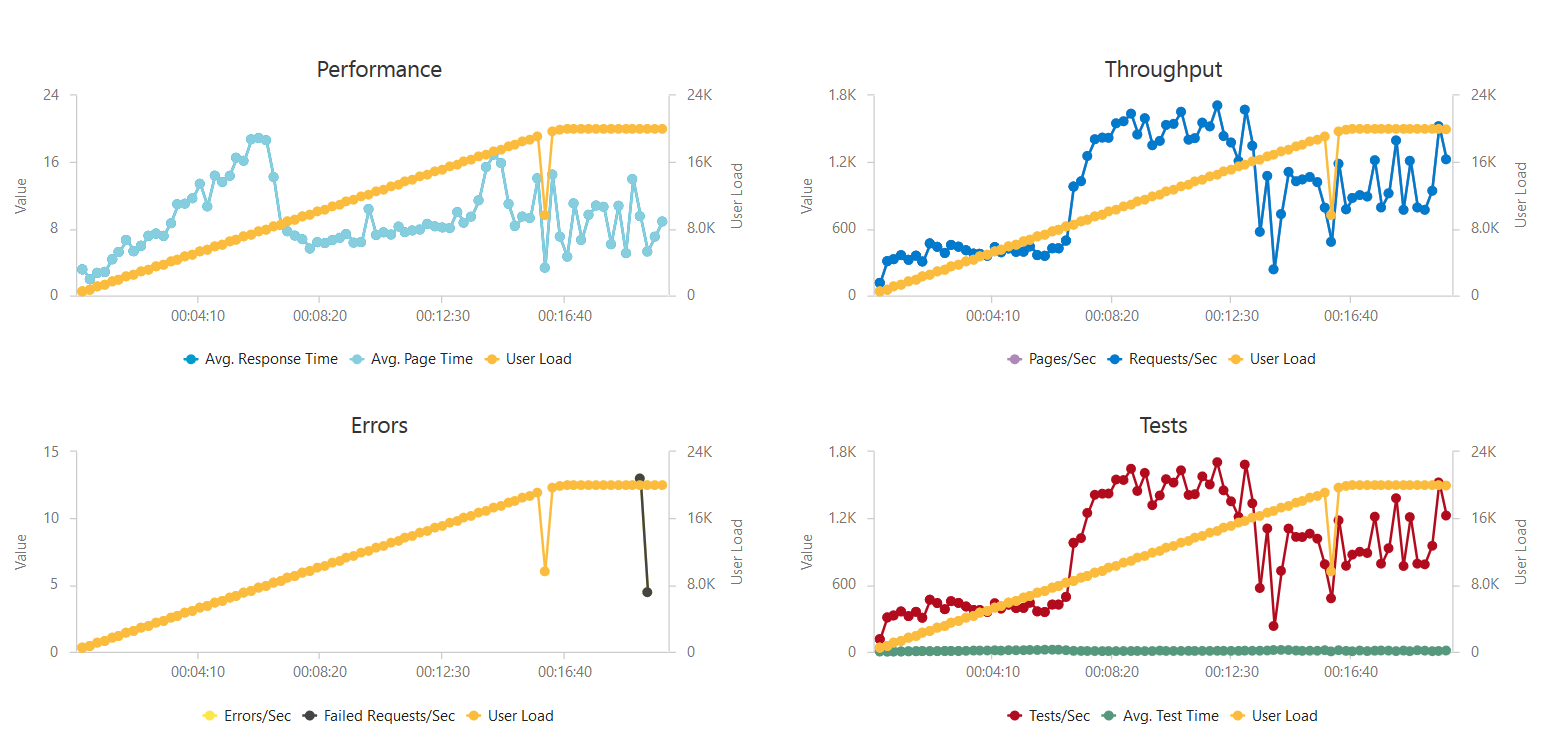
As you can see the results are not bad at all, they're actually pretty good and comparable with higher-level App Service plans. Performance grew gradually (obiously, as it's autoscaled) and reached 1k RPS in about 7 minutes.
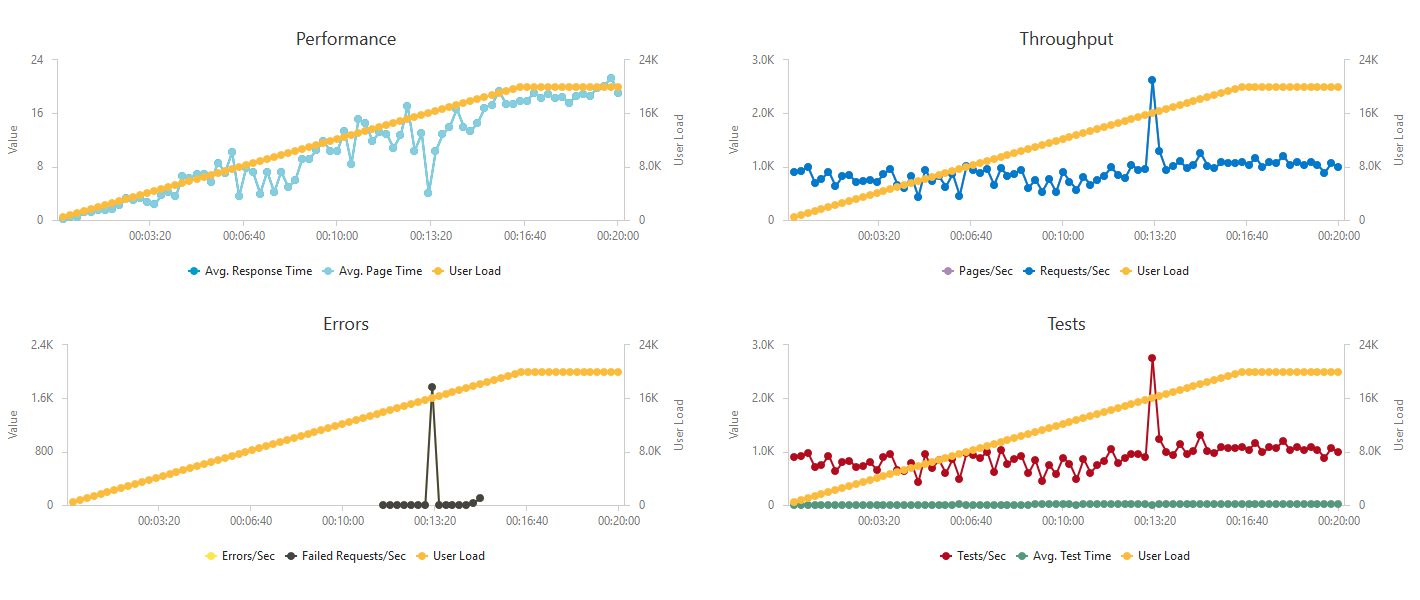
[UPDATE: 03/12/2018]
I ran the same test again with the WEBSITE_HTTPSCALEV2_ENABLED setting turned on. Here are the results:
| Total requests | 1 512 930 |
|---|---|
| Failed requests | 2 831 |
| Max servers used | 20 |
| Average RPS | 1260 |
| Max RPS | 1772 |
| Average response time | 8.77 s |
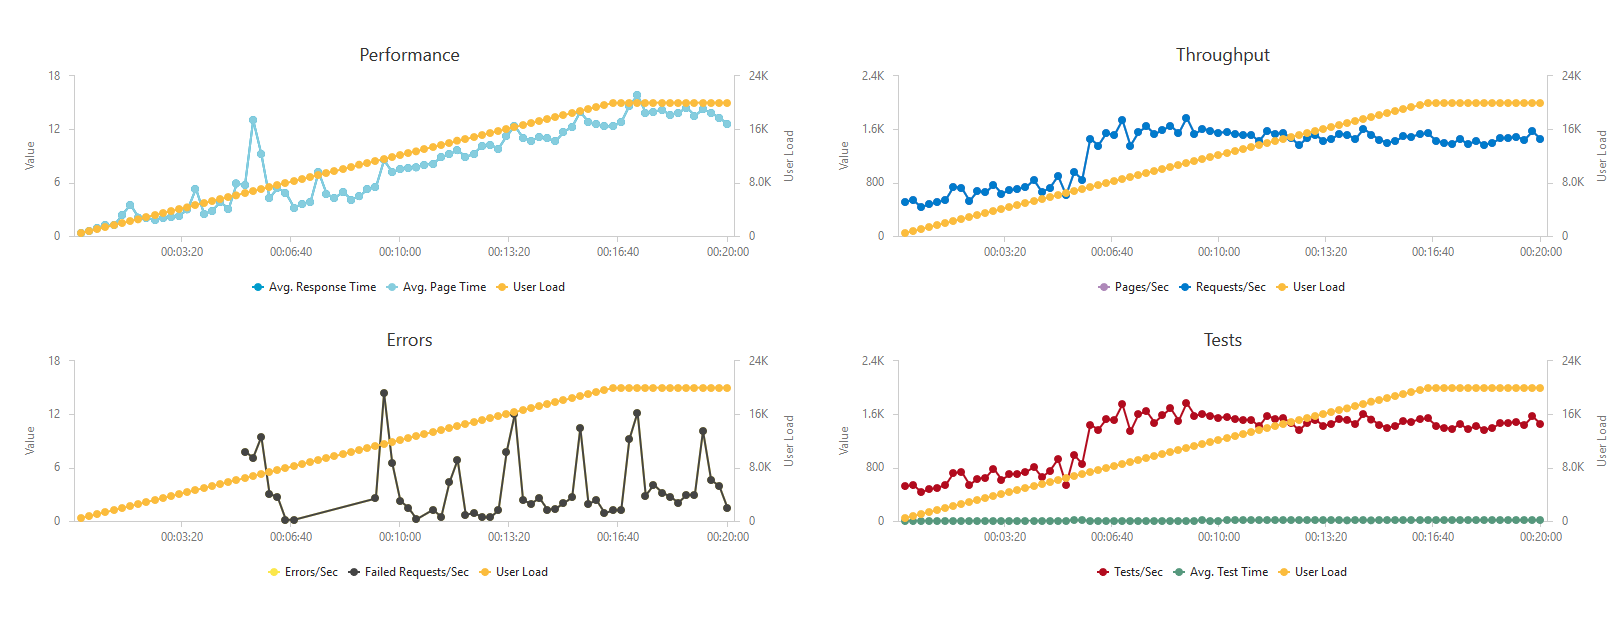
Performance got better, but the error rate increased as well. Still it was only 0.2 % of all requests. Also notice that scaling stopped at 20 servers and did not add more.
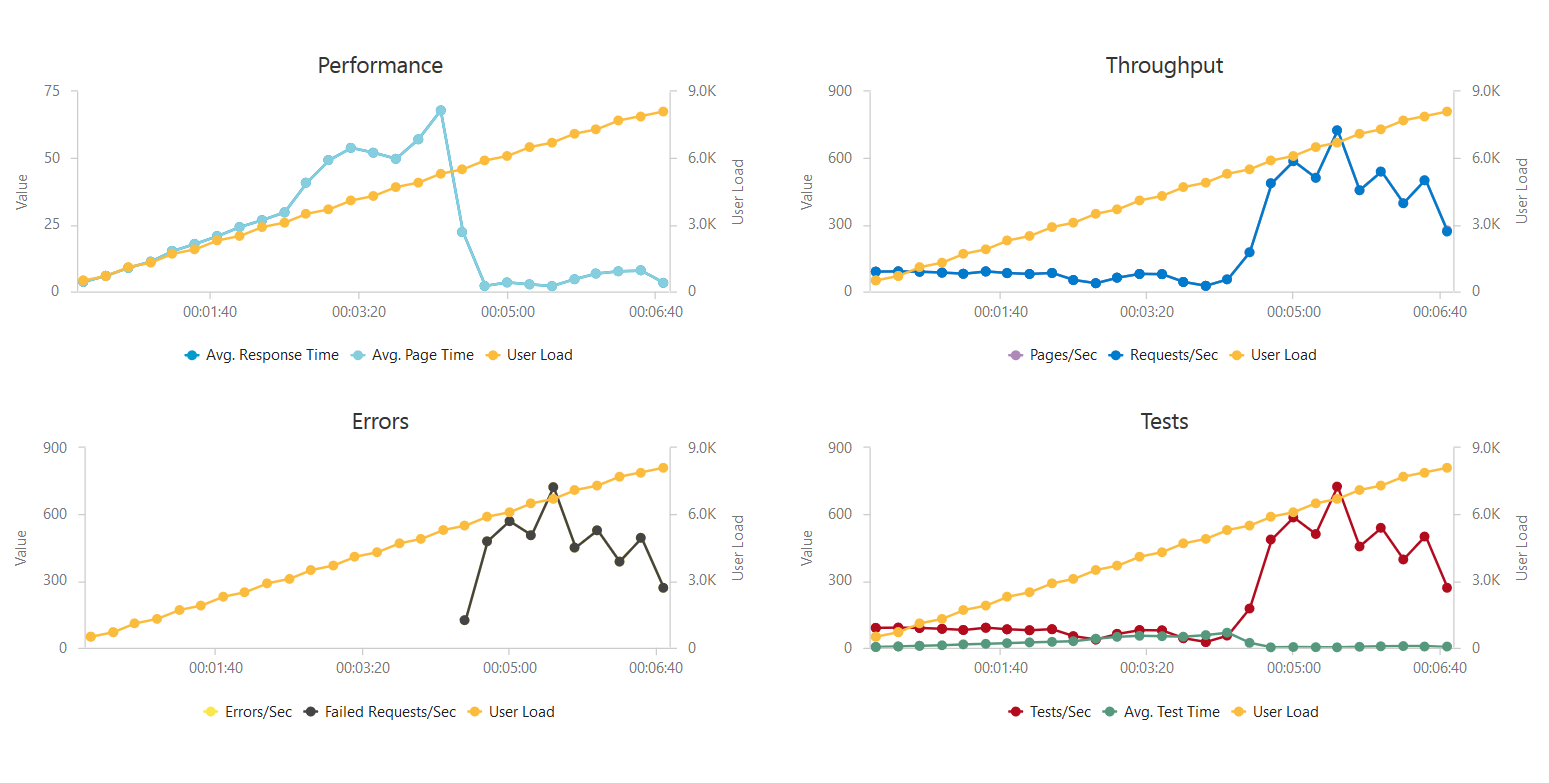
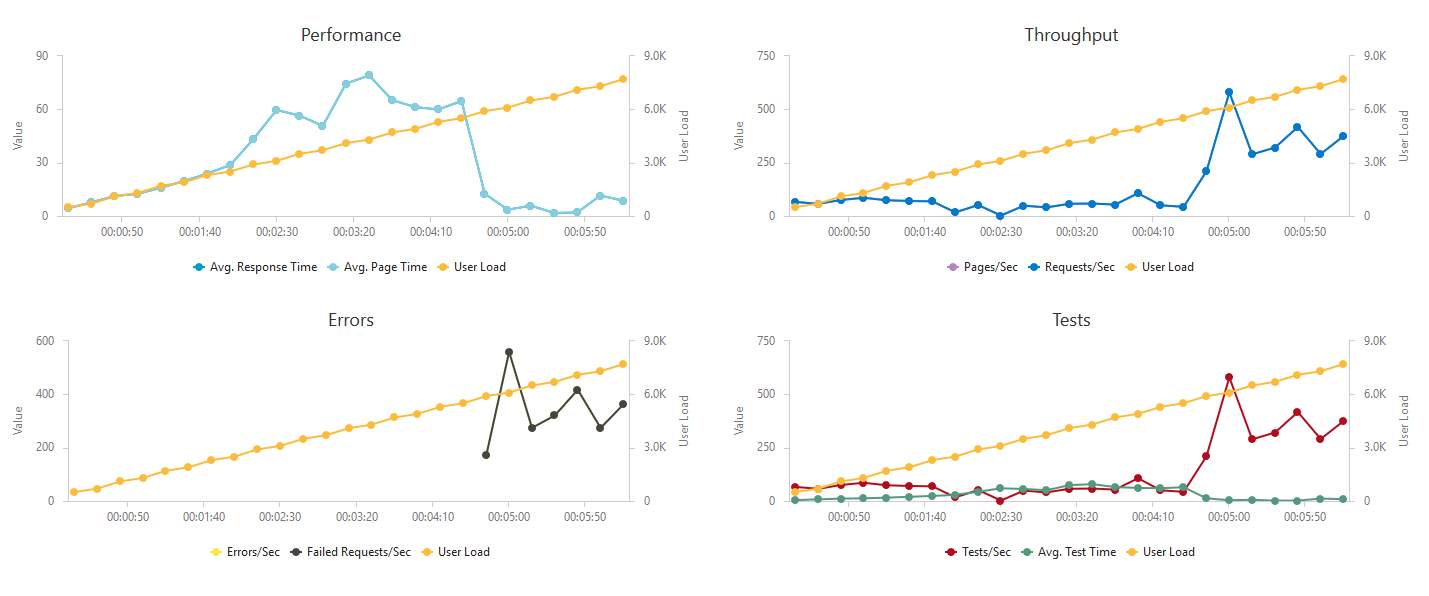
App Service plan - S1, 1 instance
Test was terminated after 6 minutes (8100 users) due to high error rate (service unavailable).
| Total requests | 8 7872 |
|---|---|
| Failed requests | 68 005 |
| Max servers used | 1 |
| Average RPS | 216 |
| Max RPS | 725 |
| Average response time | 9.7 s |
| Estimated price (20 minutes) | $0.03 |
| Estimated price (1 hour) | $0.1 |
App Service plan - S1, 5 instances
More instances of the same hardware configuration performed better, but eventually failed too.
| Total requests | 420 645 |
|---|---|
| Failed requests | 29 264 |
| Max servers used | 5 |
| Average RPS | 350 |
| Max RPS | 820 |
| Average response time | 31 s |
| Estimated price (20 minutes) | $0.17 |
| Estimated price (1 hour) | $0.5 |
Really long response time and it actually never reached the target of 1000 RPS.
App Service plan - S1, 10 instances
This configuration was included to discover the impact of increased number of instances to the overall performance. Again - not so powerful servers, but 10 of them this time.
| Total requests | 771 431 |
|---|---|
| Failed requests | 0 |
| Max servers used | 10 |
| Average RPS | 635 |
| Max RPS | 814 |
| Average response time | 14.9 s |
| Estimated price (20 minutes) | $0.33 |
| Estimated price (1 hour) | $1 |

Maximum RPS reached was similar to previous test, but the infrastructure didn't fail this time. Response times also got to a reasonable value.
App Service plan - S3, 5 instances
Let's scale up a little bit. S3 brings 4 CPU cores and 7 GB of RAM.
| Total requests | 924 709 |
|---|---|
| Failed requests | 124 |
| Max servers used | 5 |
| Average RPS | 761 |
| Max RPS | 1204 |
| Average response time | 12.45 s |
| Estimated price (20 minutes) | $0.67 |
| Estimated price (1 hour) | $2 |
Better hardware led to better results - RPS broke the 1k threshold, with average slightly below.
App Service plan - P1, 1 instance
Let's upscale even more - to the Premium plan.
This test was aborted after 6 minutes (7700 users) due to high error rate.
| Total requests | 52 594 |
|---|---|
| Failed requests | 35 683 |
| Max servers used | 1 |
| Average RPS | 140 |
| Max RPS | 579 |
| Average response time | 8.6 s |
| Estimated price (20 minutes) | $0.1 |
| Estimated price (1 hour) | $0.29 |
Similar situation to the S plan - single instance just wasn't able to handle this kind of load.
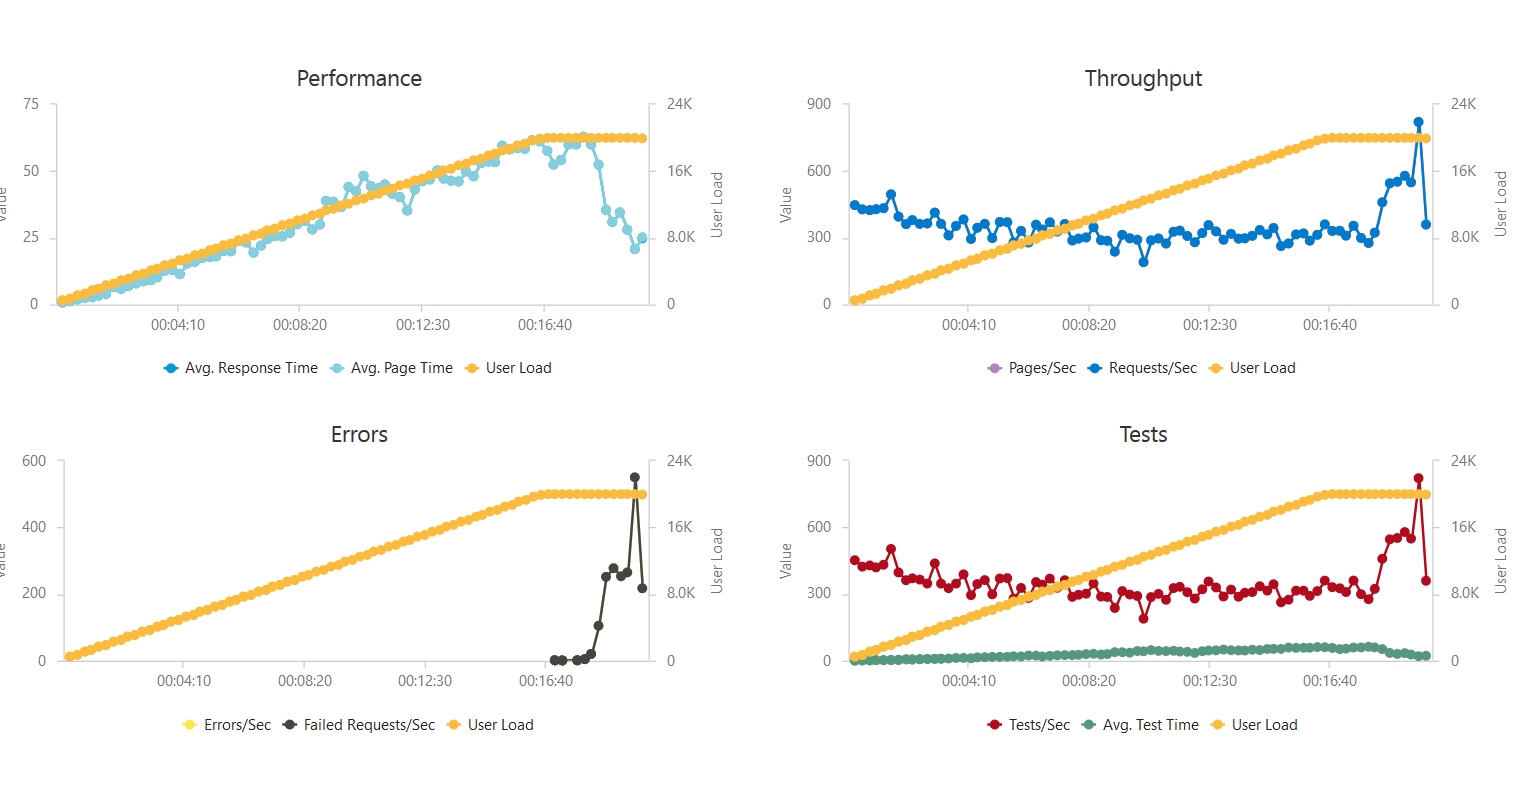
App Service plan - P1, 5 instances
Single instance was not enough, so I've added some more.
| Total requests | 474 262 |
|---|---|
| Failed requests | 56 693 |
| Max servers used | 5 |
| Average RPS | 395 |
| Max RPS | 1029 |
| Average response time | 26.85 s |
| Estimated price (20 minutes) | $0.48 |
| Estimated price (1 hour) | $1.44 |
It was interesting to see that this configuration stopped responding in 17 minutes.
App Service plan - P3, 5 instances
Scale up - to more CPU and RAM.
| Total requests | 1 086 308 |
|---|---|
| Failed requests | 28 771 (rig failure) |
| Max servers used | 5 |
| Average RPS | 905 |
| Max RPS | 2622 (rig failure) |
| Average response time | 10.9 s |
| Estimated price (20 minutes) | $1.92 |
| Estimated price (1 hour) | $5.75 |
This time the failure was caused by my test rig. It wasn't able to close connections quickly enough and reached its thread pool limit.
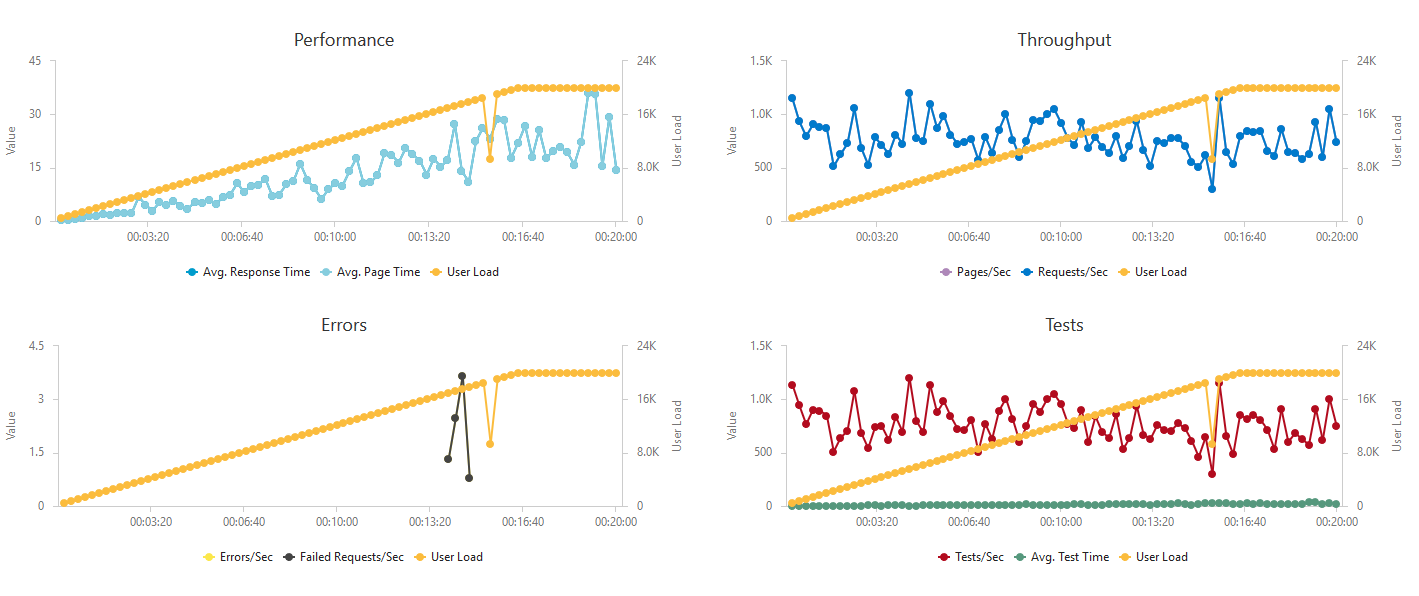
App Service plan - P3, 20 instances
As a bonus I left this beast. This is the most you can get from Premium App Service Plan without contacting Azure support. It's also the most costly option.
| Total requests | 1 770 287 |
|---|---|
| Failed requests | 0 |
| Max servers used | 20 |
| Average RPS | 1475 |
| Max RPS | 2075 |
| Average response time | 0.63 s |
| Estimated price (20 minutes) | $7.6 |
| Estimated price (1 hour) | $23 |

It's not a surprise that the Function was super responsive for the whole time, rarely dropping under 1k RPS and rarely climbing above 1 second response time. And of course the price was adequate.
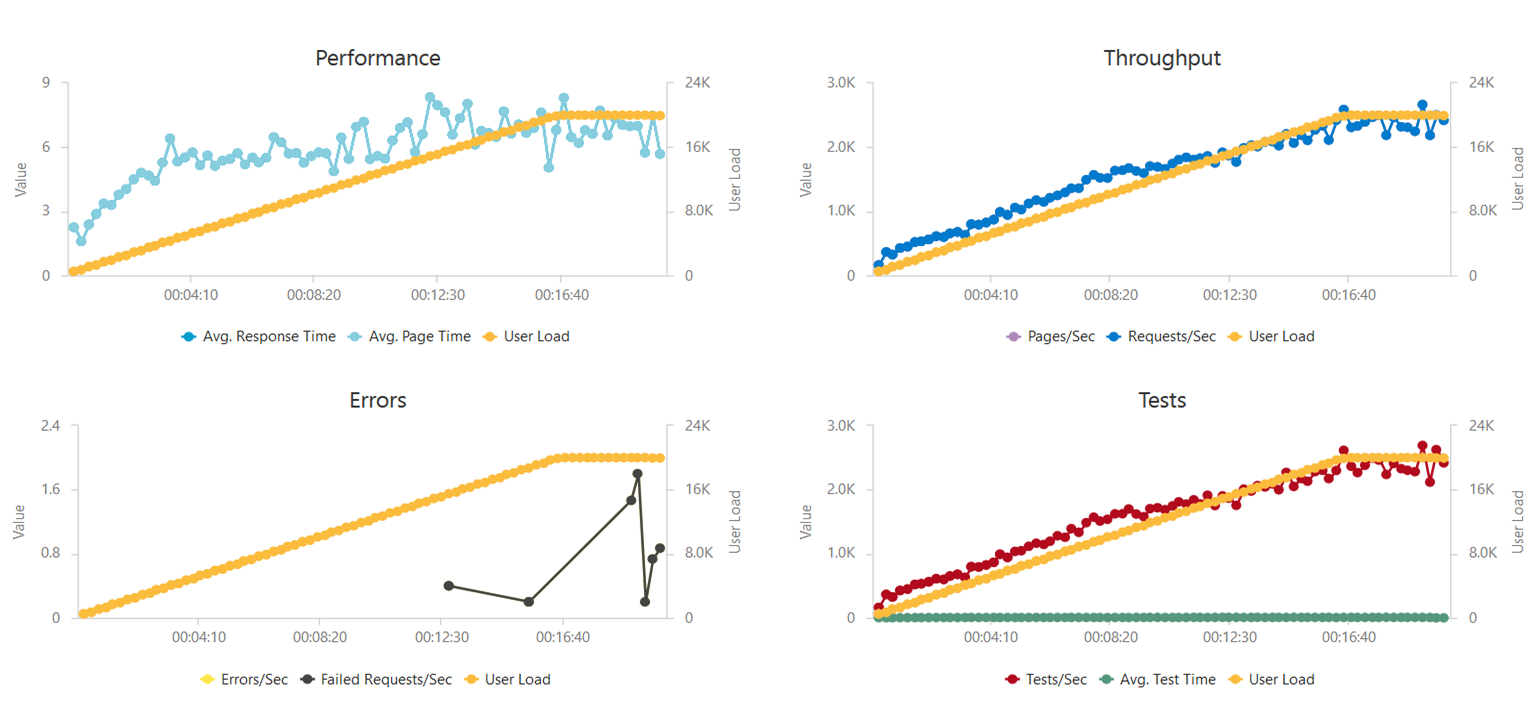
Bonus: Consumption, without Storage
To see the impact of Azure Storage on the overall performance, I disabled the "write to a Table" part from my code. And performance went up:
| Total requests | 1 907 079 |
|---|---|
| Failed requests | 85 |
| Max servers used | 39 |
| Average RPS | 1569 |
| Max RPS | 2666 |
| Average response time | 6.4 s |
Summary
"It doesn't scale!" very much applies here. Using a single instance for such high-load scenarios just doesn't make sense (the service becomes unavaiable after 6 minutes). App Service plans are steady, but take some time/experience to fine tune the right configuration for specific load which doesn't cope well with sudden and short spikes.
Consumption plan is great for sudden load spikes - it scales quickly, but the price follows. It's suitable for on/off situations where your application isn't under a steady load, but it's occasionaly hit hard.
When deploying such function don't forget to turn logging off :)
And if 1000 RPS is not enough for you, check this article where the Functions team streched up to a 100,000 events per second (yes, events, not requests, but still...).
Feedback
Found something inaccurate or plain wrong? Was this content helpful to you? Let me know!
📧 codez@deedx.cz